The relationship between attendance during the first five weeks of the semester and final grades is shown in the chart below.
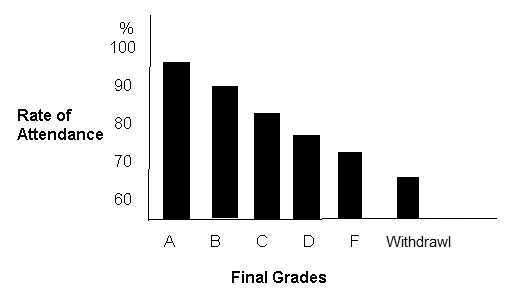
This chart shows that students who attend classes frequently at the beginning of the semester receive higher final grades than do students who miss classes. Attendance and final grades continue to be related to each other for the entire semester.
A and B students attend between 90% and 95% of classes at the beginning of the semester. C and D students attend 80% to 85% of classes. Students who fail or withdraw attend only 70% to 75% of these classes.
Many important factors work together to influence final grades. Attendance is a factor that you can easily control. If you improve your attendance, then your grades will probably improve. Your opportunities to learn increase when you attend class more often.
These findings are based on research conducted at the Center for the Improvement of Teaching and Learning, The City Colleges of Chicago.